I have a dataset containing six features, around 13000 records, and representing an urban road network. I imported data as a dataframe into Jupyter and table below demonstrates the sample of this data.
| Road type | Speed Limit | Road Slope | Number of Lanes | Radius |
|---|---|---|---|---|
| Highway | 100 | -8 | 2 | 100.01 |
| Local | 30 | -2 | 2 | 400.21 |
| Primary | 70 | 0 | 4 | 2035.43 |
| Secondary | 50 | 2 | 5 | 0 |
| Highway | 100 | 5 | 1 | 0 |
| Local | 30 | 8 | 4 | 0 |
For more clarification: "Road type" shows the type of road (as its name implies), speed limit (km/h) demonstrates that driving in a street shouldn't exceeds a speed. Road slope (unit = percent) illustrates the slope of road and Radius (unit = meter) shows the radius of road curvatures. In addition, drawing heatmap showed that the features are independent in except the "Road type" and "Speed Limit" which are 75% correlated.
What is the problem
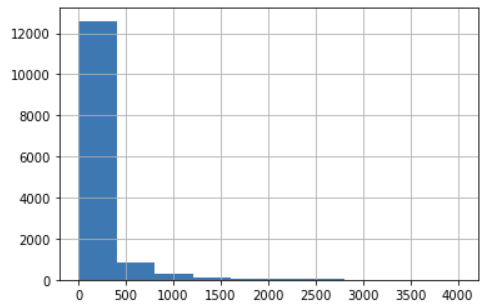
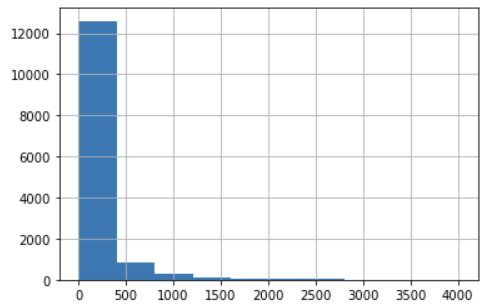
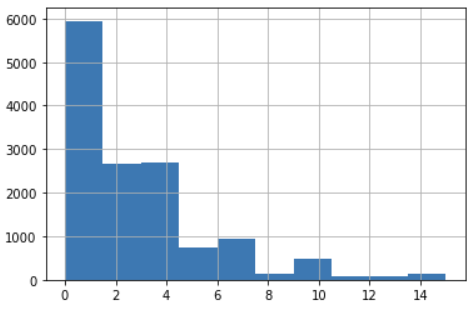
First of all, as you see data has mixed type values. Second, if you compare the "Radius" values with the other fields you notice data are unscaled as well. And the third issue as images below show approximately all features are skewed. Finally, drawing heat map showed that all features are independent, in except, the "Road type" and the "Speed Limit" which are 75% correlated.
What are my questions
In terms of clustering techniques, I have already read the former post and I know the "Gower distance" can be used with AHC in this case. But my question is:
In order to improve the accuracy of clustering, as the values of numerical features are not in a same scale, can I standardize them? if so, as speed limit is correlated with Road type can I standardize it?
What is you suggestion to cope with skewness?


df["Road type"] = df["Road type"].astype('category').cat.codes$\endgroup$